
Better Together?
2.2x richer, 30% cheaper: What 1,980 Money Diaries reveal about (inter)personal finance.

Every Money Diary opens the same way. Age. Salary. Net worth. If there’s a partner, maybe you get a second salary number. Spoken or unspoken, the question lingers: are two wallets actually better than one?
Luckily I’ve got my handy-dandy 10 years of Money Diaries, mined from over 10 years of Refinery 29 posts. I was surprised by what surprised me. Let’s take a look-see.
The truth is...
Not as ugly as I’d expected! You’ll see what I mean.
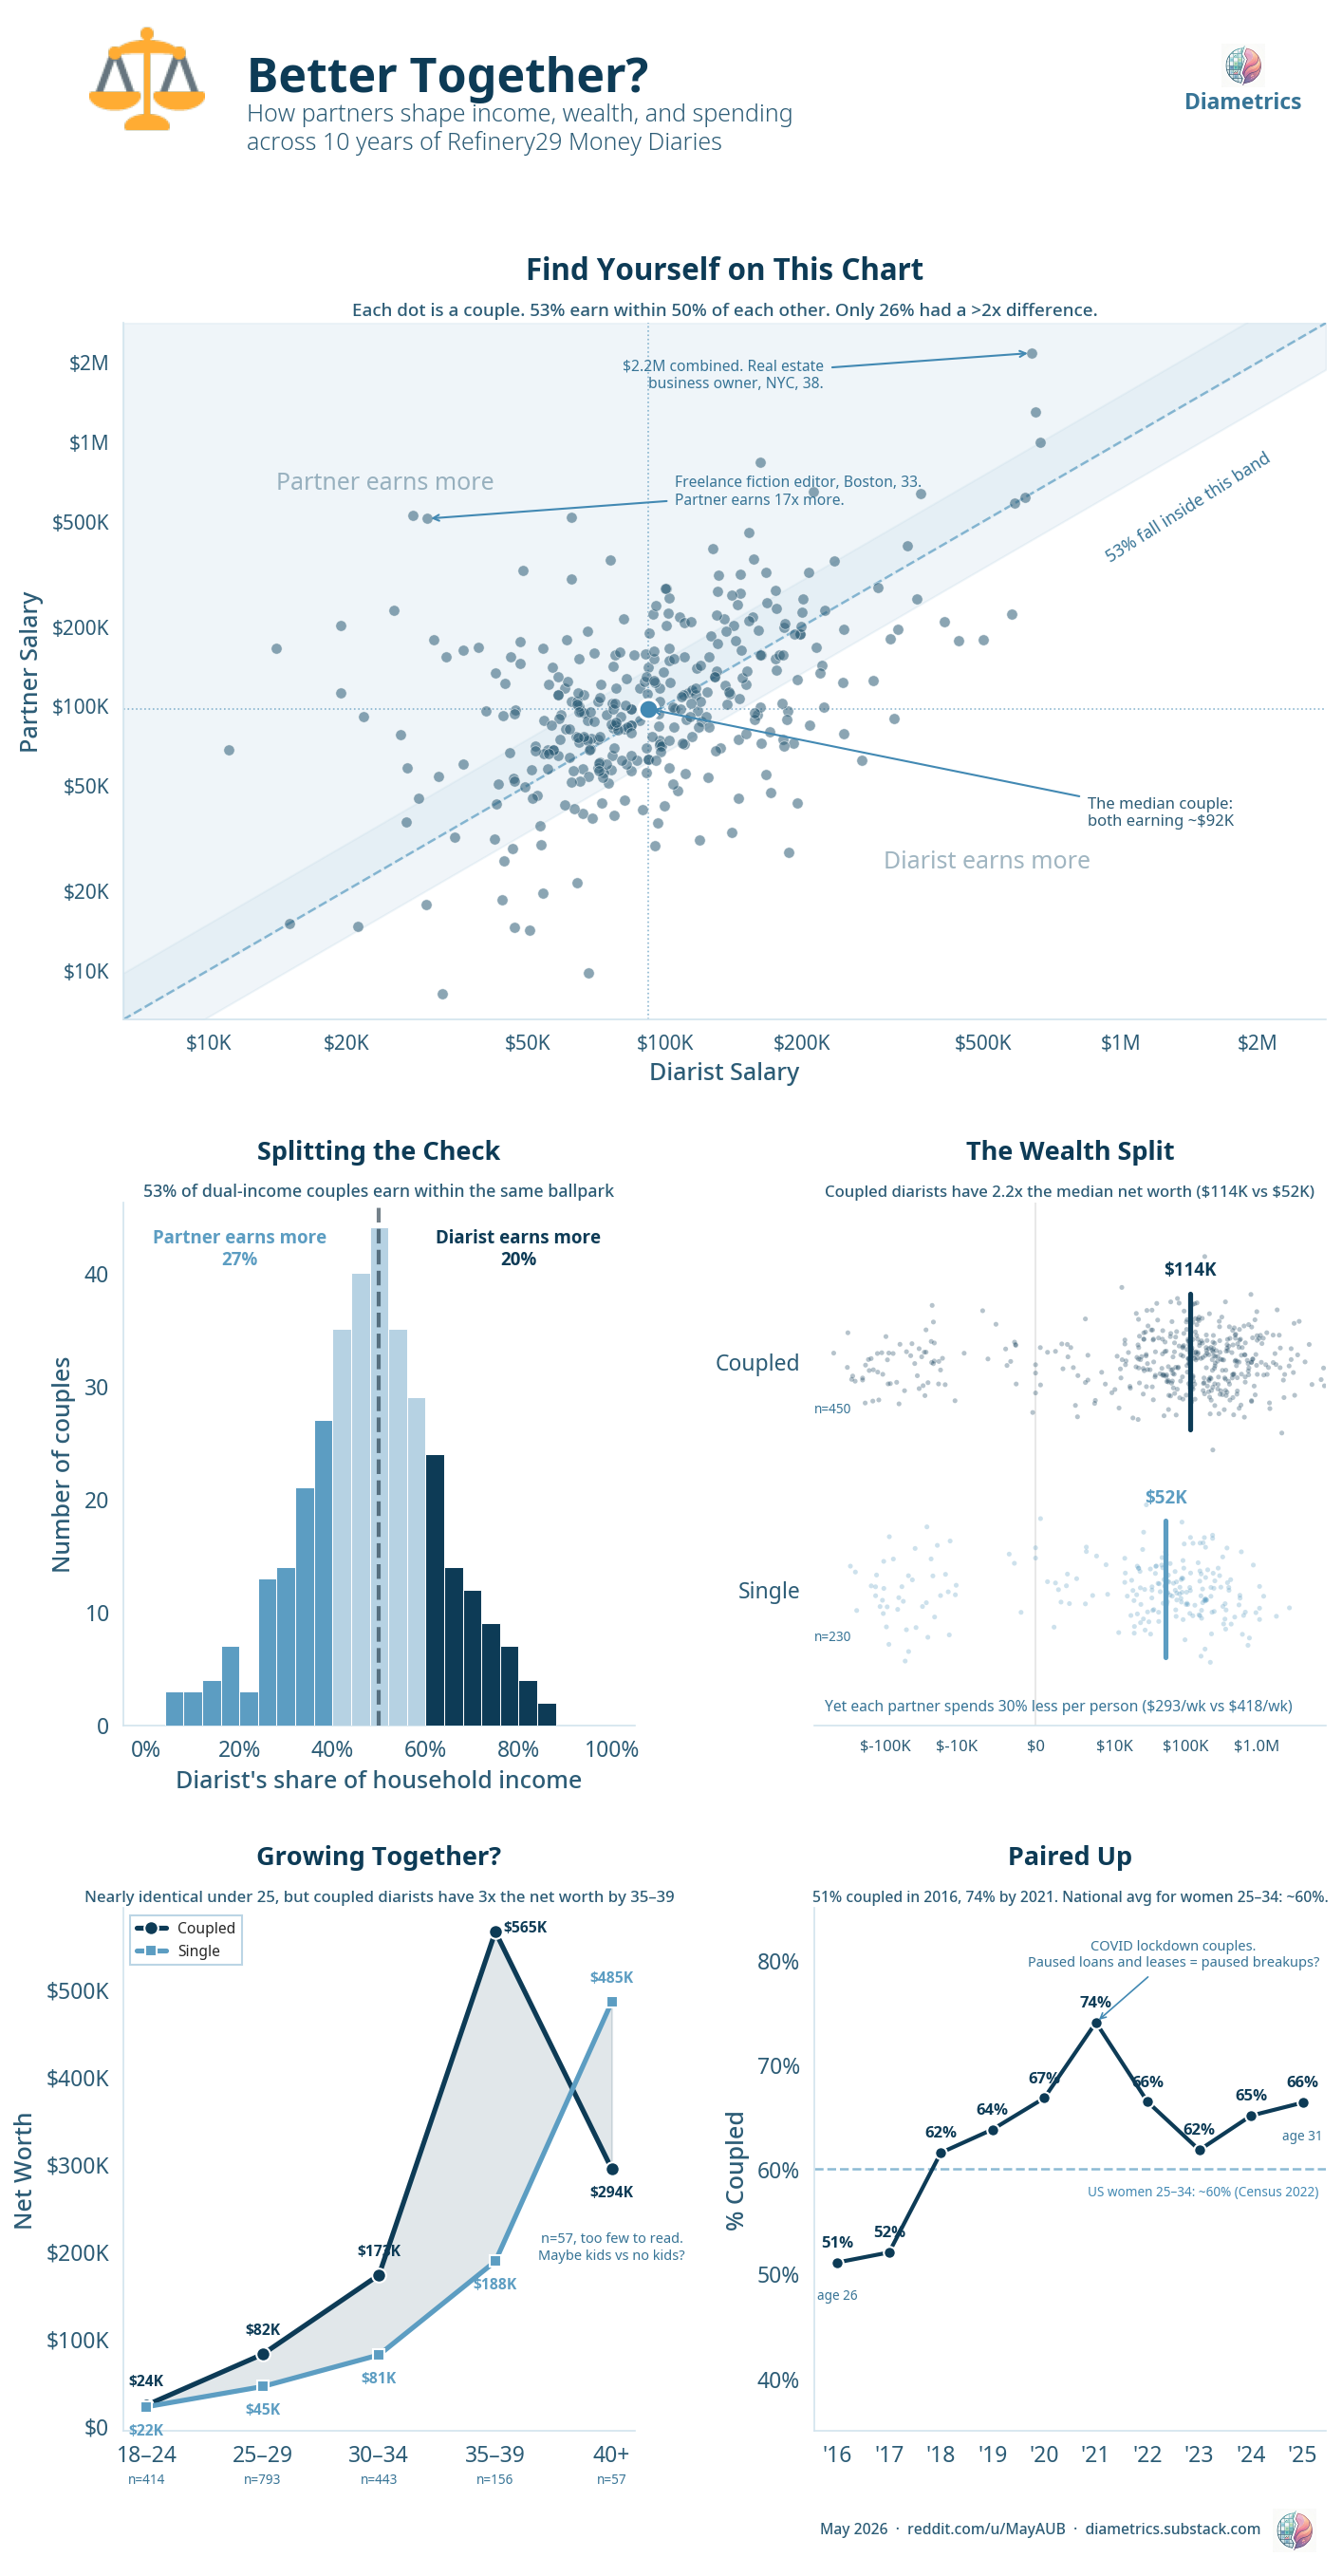
In our headline visual today, each dot is a dual-income couple, with the diarist’s salary on the X-axis and their partner’s salary on the Y. The dashed diagonal line is equal pay. Above it, the partner earns more. Below, the diarist does.
See what I mean?
It’s surprisingly balanced around the center. The median couple has two $92k incomes. You can see it in the cloud: couples cluster along the diagonal, not scattered randomly. The shaded band around that diagonal shows where salaries are within 50% of each other, and 53% of couples fall inside it. Only 26% had a greater than 2x difference. Most dual-income couples really are in the same ballpark, and the median couple has two $92k incomes.
That dot way up in the top-right? A 38-year-old real estate business owner in NYC pulling $500K while her partner earns $1.7M. Combined household income of $2.2M. Her idea of a splurge? $45 lipstick purchase.
On the other extreme: a 33-year-old freelance fiction editor in Boston earning $25K while her partner brings in $425K, our biggest difference, at 17x more.
If you squint a bit, you can see that there are more outliers above the band than below the band, but in a self-selected and curated dataset like this, we can’t draw too many conclusions.
Splitting the check
Viewed as a histogram, we see the same pattern. Our 53% “roughly equal” band has each partner earning 40-60% of household income. In 27% of couples, the partner clearly out-earns the diarist. Only 20% of diarists clearly out-earn their partner.
Dead center of that equal zone? A 32-year-old PR account director in Chicago who was on maternity leave when she wrote her diary. She and her partner each earn $105,000. Exactly. Down to the dollar. She spent $44 on a smoke and carbon monoxide detector that week, which might be the most responsible purchase in the entire dataset.
Personal economies of scale
Next to the histogram: every diarist who reported net worth, plotted as a dot. Not just dual-income couples, but single, too.
The median coupled diarist has $114K in net worth. The median single: $52K. Basic math would have us expect a 2x gap, but Money Diaries’ real gap is actually 2.2x. You can see it in the dot density: the coupled strip sits further right, with more mass above $100K.
Here’s the twist: each partner actually spends 30% less per person.
Single diarists spend $418/week.
Coupled households spend $586/week total. $293/week/person.
Sharing a kitchen, splitting a rent check, using one Netflix login, Costco membership. These are our personal economies of scale.
When does the gap kick in?
Bottom-left: net worth by age. At 18-24, coupled and single diarists look almost identical ($24K vs $22K). Everyone starts at roughly the same line.
By 25-29, coupled pulls to $82K vs $45K. That’s 2x.
By 30-34, it’s $173K vs $81K. Still about 2x but the absolute gap is growing.
And at 35-39, coupled hits $565K vs $188K. That’s 3x.
Then something odd happens at 40+. The single line surges to $485K and the coupled line drops to $294K. But Money Diaries skew younger, so we only have 57 data points. At that point we’re looking at individual stories, not trends. Maybe it’s a kids-vs-no-kids effect, maybe it’s just noise.
The reliable takeaway: through your 30s, coupling appears to accelerate wealth building. I expect that continues, but the data gets too thin to say for sure.
Paired up
The bottom-right panel tracks how the readership itself changed. In 2016, 51% of diarists were coupled, below the national average for women 25-34 (~60%, per Census 2022). By 2021, that hit 74%. The median age went from 26 to 31 over the same span.
That 2021 spike is interesting. COVID lockdown couples: paused loan repayments, frozen rents, fewer breakups? Hard to say from this data alone, but the timing lines up.
Money Diaries started as a column for 20-somethings figuring things out. These days, the audience had grown up. More couples, older writers, higher stakes.
The splurge angle
One finding that didn’t make the infographic, but I was curious about: coupled diarists tag 1.9% of their transactions as splurges vs 2.2% for single diarists. When they do splurge, coupled diarists spend a median of $32 vs $26 for singles. So single diarists splurge slightly more often, but coupled diarists spend slightly more when they do. Net effect is basically zero. Coupling doesn’t seem to change your relationship with impulse spending much at all.
Next up
I’m still loving this dataset! I’m hitting housing next, and started exploring some geographic spending. What’s on your mind that might be revealed in the crystal ball of the Money Diary? Drop it in the comments.
Subscribe for more. And for the Redditors, come join us at /r/MoneyDiariesActive.